The reported measurement
An event definition comes before a percentage
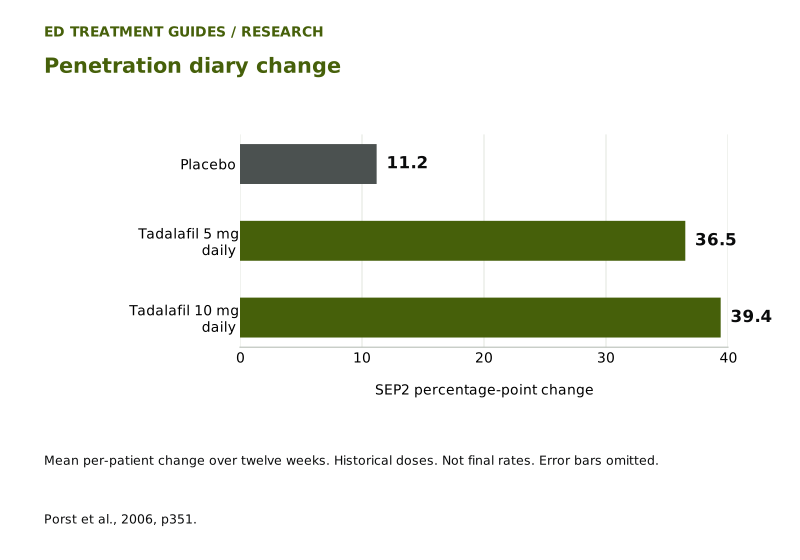
SEP2 results summarize mean per-person change in the percentage of attempts with successful penetration.
To interpret a diary measure, begin with the event it records. Similar-sounding events may represent different stages of an experience. Recording that an activity began is not identical to recording that it finished. A sound interpretation preserves that distinction rather than letting an everyday word such as success silently expand the outcome definition.
Then ask whose information is being summarized. An event is an observation; a person may contribute several observations. A percentage calculated inside each person’s diary and a percentage calculated after combining diaries are different mathematical objects. Neither is inherently the only useful quantity, but each needs its own label. The following exercises explain why the order matters.
Readers seeking broader treatment context can consult the tadalafil guide. Here, the practical starting point is smaller: write down the event, the unit of observation and the order of calculation. That short description often prevents more confusion than an extra decimal place. It also identifies what information would be needed to reproduce a calculation independently.
Sources: 1
Percentage points describe subtraction, not proportional growth
For an explicitly fictional diary exercise, imagine that the proportion of completed puzzles rises from twenty percent to thirty-five percent. The increase is fifteen percentage points, obtained by subtraction. Relative to the starting value, that same increase is seventy-five percent: fifteen divided by twenty. The two statements describe the same imaginary movement with different denominators. Neither number is an ED outcome.
A percentage-point difference stays on the original percentage scale. A relative percent change instead asks how large the change is compared with the starting level. The distinction matters because a small starting denominator can make a relative change appear large. Without that denominator, a reader cannot reliably translate a reported difference into proportional growth.
The table separates the quantities so that each retains its meaning. This is a reading method, not a template for recalculating an adjusted clinical analysis. When an article uses the word increase without naming the unit, pause and identify which calculation it represents. The unit is part of the result, not decorative text that can be dropped from a headline.
| Quantity | Calculation | Meaning |
|---|---|---|
| Starting proportion | 20% | Initial level |
| Later proportion | 35% | Later level |
| Absolute change | 35 − 20 = 15 percentage points | Difference on the percentage scale |
| Relative change | 15 ÷ 20 = 75% | Change relative to the starting level |
Sources: 1
Equal weight for people is different from equal weight for events
Consider another fictional puzzle exercise. Diary A records one completion in two attempts, giving fifty percent. Diary B records nine completions in ten attempts, giving ninety percent. Averaging those two personal percentages gives seventy percent. Pooling all attempts instead gives ten completions in twelve attempts, or about eighty-three percent. Nothing about the entries has changed; only their weighting has changed.
In the personal average, each diary contributes one percentage. In the pooled calculation, a diary with more attempts contributes more observations and therefore has greater influence. A result described as per-person should not silently become a statement about all attempts placed in a common pool. Conversely, an event-level calculation cannot automatically describe the proportion experienced by a typical person.
This distinction also explains why a participant count is not an attempt count. Knowing how many diaries exist does not tell you how many events they contain. To reproduce either calculation, the relevant denominators must be available. The example is deliberately small enough to inspect by hand, making the weighting visible instead of concealing it inside a single percentage.
| Record or summary | Calculation | Result |
|---|---|---|
| Diary A | 1 completion ÷ 2 attempts | 50% |
| Diary B | 9 completions ÷ 10 attempts | 90% |
| Average of personal percentages | (50% + 90%) ÷ 2 | 70% |
| All attempts pooled | 10 completions ÷ 12 attempts | About 83% |
Sources: 1
A larger change need not mean a higher ending level
Take a third fictional puzzle example. One diary moves from fifteen percent to forty percent, a rise of twenty-five percentage points. Another moves from fifty-five percent to seventy percent, a rise of fifteen points. The first improves more in absolute terms; the second ends higher. Those statements can both be true because improvement and final level answer different questions.
The same distinction applies when summarizing groups, with an added requirement: preserve the analysis population. If the group contributing the starting value differs from the group contributing the later value, subtracting the displayed group summaries may not reproduce an average of paired individual changes. Pairing means linking each person’s later observation with that same person’s earlier observation.
For a reader, the useful habit is to specify the time comparison before interpreting magnitude. Does a statement concern where participants ended, how far they moved, or how two groups differed after an analytical adjustment? Those are separate quantities. The fictional example supplies no basis for converting a published change into a final rate; it simply shows which additional starting information such a conversion would require.
Sources: 1
Why improvement in a control group deserves attention
Imagine asking two groups to record a behavior repeatedly. Recording itself, changing circumstances, expectations and ordinary fluctuation are possible influences on what appears in the diary. An improvement within a group does not identify which influence produced it. This is a methodological thought experiment, not an account of the cause of any observed placebo response.
A concurrent comparator helps frame the question more narrowly: what difference is associated with assignment to the intervention under the study conditions? Random allocation is intended to prevent assignment from following characteristics that also predict the outcome. Blinding addresses knowledge of allocation. The two design features serve different purposes and do not eliminate the need to inspect the measurement or analysis.
Control-group movement therefore should not be dismissed as empty noise, nor should it be treated as proof of a particular psychological mechanism. It forms part of the comparison. To estimate an intervention effect, use the specified between-group analysis and its uncertainty, not simply the most favorable within-group movement. A prominent increase can be real as a description while still being insufficient as a causal explanation.
Sources: 1
Missing diary entries create a measurement problem
A blank entry is not automatically a failed event. It might mean no event occurred, an event was forgotten, or an entry was omitted for another reason. These possibilities have different consequences for a denominator. Coding them all alike would embed an assumption about the missing information, whether or not that assumption was visible in the final graph.
Observation windows matter as well. A longer recording period may contain more events, but more events are not the same as more independent people. Repeated observations from one person can share features of that person’s circumstances. A statistical analysis needs to reflect the structure of its data rather than treating every recorded mark as an unrelated new participant.
When inspecting a report, look for the rule defining an eligible measurement, the period covered and the handling of absent data for that endpoint. Do not transfer a missing-data rule from one instrument to another merely because both appear in the same paper. A useful sensitivity question is whether another plausible treatment of missing information would materially alter the conclusion. That question can identify a limitation without asserting an unsupported direction of bias.
Sources: 1
A taller bar does not establish the best regimen
Ranking the heights of several bars is easy; establishing a defensible treatment ranking is harder. A numerical ordering does not reveal the uncertainty around the differences or whether the study analysis was designed to support the comparison a reader wants to make. Evidence against a control and evidence that one active regimen outperforms another are distinct questions.
This also limits comparisons across separate papers. The companion sildenafil evidence guide develops another measurement exercise. Reading the articles together can improve statistical understanding, but it does not create a shared randomized comparison. Similar topics do not ensure identical populations, outcome definitions or analytical assumptions.
A practical way to resist an unsupported ranking is to state the proposed comparison in a complete sentence, including who, what measurement and when. Then identify which reported analysis addresses that sentence. If none does, the result may still motivate a question for future research. It should not acquire the authority of a tested conclusion simply because the bars are easy to order. Precision information and a suitable design are substantive requirements, not finishing touches.
Historical study arms are not present-day dosing advice
Current Cialis labeling describes 2.5 or 5 mg for daily ED use; historical 10 mg daily is not that routine approved regimen. Nitrates and guanylate cyclase stimulators such as riociguat are contraindicated. Cardiac status, kidney/liver function, medicines and substantial alcohol use require review. Do not self-combine ED therapies. Listed adverse reactions include headache, indigestion, back pain and muscle pain. Erection beyond four hours requires immediate help. Sudden vision loss or hearing decrease/loss requires stopping medicine and prompt care; chest pain, dizziness or nausea during sex requires stopping activity and immediate help.
Those current-label statements are separate from the diary calculation. Our daily versus on-demand comparison and PDE5 safety guide provide further reading for a clinical discussion. A study arm describes an intervention being investigated. A prescription additionally requires a decision about the person, the proposed product and current information.
Keeping the two documents in their respective roles prevents historical research from becoming an informal dosing instruction. It also prevents a favorable efficacy figure from substituting for an assessment of risk. An article can clarify the scientific question while leaving the individual prescribing decision where it belongs.
Keep formulation evidence separate from ordering information
Compounded drugs lack FDA approval and the agency’s premarket assessment of safety, effectiveness and quality, while potentially meeting individual medical needs. Our editorial inference is that evidence about an ingredient does not establish the performance of every finished preparation containing it.
To evaluate a product claim, first identify the proposed preparation and the evidence said to support it. Then ask whether the outcome, route and formulation in that evidence match the claim. A mismatch identifies an unanswered question; it does not by itself establish that a product works better, works worse or is equivalent. Those are additional conclusions requiring appropriate evidence.
The Ro review and Hims review can be used to inspect documentary service terms. They do not establish availability of the studied regimen or reproduce clinical results. As an editorial organizing method, keep a service checklist separate from the research question. Payment arrangements, communication and ordering steps may matter to a purchase decision, but they cannot validate a biological effect. Likewise, any nearby promotional speed ranking remains outside the conclusions supported by this research display.
Write a question that preserves the denominator
A clear question names the event and the population before asking whether a result is meaningful. For a fictional diary project, one might ask whether a change describes the average diary owner or all events combined. That wording immediately identifies which calculation is relevant. Asking only whether the percentage is high would leave the central ambiguity unresolved.
The next question concerns the intended use of the answer. Describing a study group, forecasting a personal experience and comparing available care arrangements are different tasks. A good reading note records which task the evidence addresses and what information remains necessary for the others. This avoids treating an unanswered question as either a proven benefit or proof that the evidence has no value.
For care-oriented reading, the first ninety days guide and guide to an unsatisfactory medication response offer separate next steps. The contribution of the present analysis is a more precise vocabulary for that discussion. When the numerator, denominator, time comparison and weighting stay visible, a conversation can focus on the uncertainty that actually matters instead of arguing over an ambiguous word such as success.
Editorial assessment
Diary evidence becomes easier to read when each calculation has an explicit object: an event, a person, a time period or a contrast. The fictional exercises show that changing one of those objects can change the answer without changing the underlying entries. Our editorial assessment is therefore to preserve the full measurement definition before discussing magnitude. That practice makes the evidence useful for forming precise questions while avoiding an unsupported promise about a product, provider or individual outcome.
Evidence limits
Lilly ICOS funded; company authors/statistical/writing support. Full paper retained October 23, 2026; reread October 24. Renewed access blocked; protocol, supplements and individual data unreviewed. Current labels and FDA material checked October 24. Clinical review is not claimed.
Frequently asked questions
Does a percentage-point increase identify the final percentage?
Why can pooling the same diaries produce a different answer?
Can I interpret every blank diary entry as an unsuccessful event?
Would subtracting active and control bars reproduce the trial analysis?
What would make a cross-study comparison informative?
What this is based on
We link to primary sources — clinical guidelines, regulator publications and peer-reviewed research — wherever possible. Links open on third-party sites we do not control.
- [01]Original primary paper. Porst et al. (2006): daily tadalafil trial.Checked 2026-10-24. Full paper (public exhibit).
- [02]Original primary paper. Goldstein et al. (1998): oral sildenafil trial.Checked 2026-10-24. Full paper (public exhibit).
- [03]Current prescribing information. Cialis (tadalafil) prescribing information.Checked 2026-10-24.
- [04]Current prescribing information. VIAGRA (sildenafil citrate) US prescribing information.Checked 2026-10-24.
- [05]FDA public information. Understanding the risks of compounded drugs.Checked 2026-10-24.